ML Experiments at Sift Science, Pt. 2: Analyzing Thousands of Models
In the first post on ML Experiments at Sift Science, we described how we minimize bias in our offline experimentation framework to ensure we run representative experiments. Once this is achieved, the next step is to determine how to compare the results of two separate experiments. At Sift this is non-trivial because:
- Every Sift Score is a function of several distinct models. The final score is produced by an ensemble model which combines the output from multiple globally-scoped models and multiple customer-scoped models. Here, “globally-scoped” means “trained over all of our customers’ data”.
- We produce 4 different types of Sift Scores — one for each abuse prevention product.
- We have thousands of customers which we would like to include in our experiments. Each of these customers has their own customer-specific models, complete with their own custom features, class skew, and noise levels.
Put together, we have tens of thousands of different models we could potentially evaluate. Clearly, it is not feasible to examine 10,000+ ROC plots, F1 scores, etc.; we need some way of summarizing these evaluations.
Below we describe a few specific lessons we’ve learned in this area along with their motivating problem.
We need to evaluate our models in a threshold-agnostic manner
Problem: threshold-based evaluation metrics misrepresent our models’ accuracy
All of the models we train are used as soft classifiers to produce scores in the range [0, 1], where 1 indicates a very high likelihood of fraud, and 0 indicates a very low likelihood of fraud. Instead of thresholding these soft predictions on our end, we surface them directly to our customers, who may use them in a number of ways. A common use case is to pick two thresholds: one that determines when a user is blocked, and one that determines when a user is reviewed. However, more advanced customers may leverage additional thresholds to alter other aspects of their product; for example, some customers will present a more streamlined checkout process to users with very low scores.
Because of this diversity in use cases, we cannot use any evaluation metrics that are a function of a fixed threshold when evaluating our models. This includes raw precision, recall, and false positive rate metrics, as well as any metrics derived from them (such as F-1 score).
Solution: use evaluation metrics that are not tied to a specific threshold
Our solution is to assess our models in a threshold-agnostic manner by measuring the probability of a bad user being assigned a higher score than a good user. To do this, we construct a receiver operating characteristic (ROC) curve and measure the area under it. While this area is very useful for summarizing the accuracy of a model with a single metric, we have also found that examining the ROC curve itself can provide further insight into how a new model is better than an existing one, again in a threshold-agnostic manner.
For example, in the following plot we see the ROC curve for two competing models:
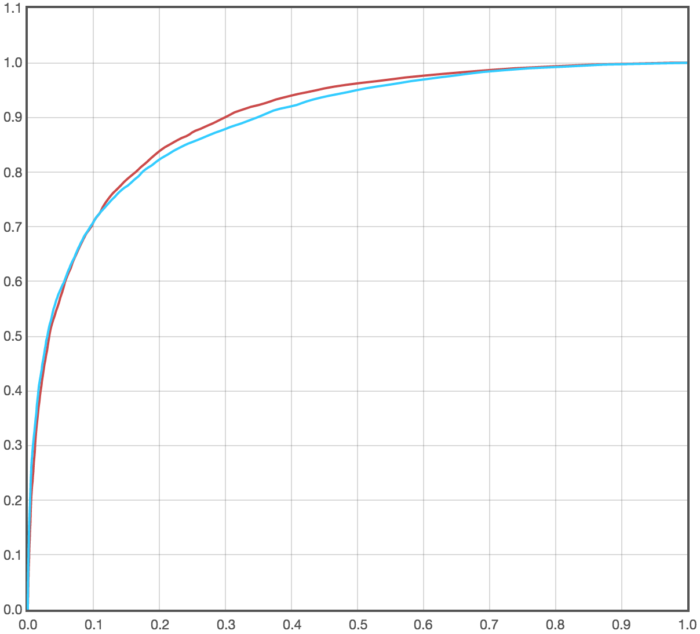
The model represented by the red ROC curve has a greater ROC AUC than the model represented by the blue ROC curve. However, by examining the actual curves we can see that all of the improvement occurs at operating points with false positive rates greater than 0.1, and that below that point the model in blue is actually better. If the customer in question happened to only operate with a false positive rate less than 0.1, as is common for our customers, then the experiment that yielded the red ROC curve would not result in an improvement for them.
We need to partition score samples by customer
Problem: combining samples across customers leads to misleading results
A natural way to evaluate one of our models would be to take all scores it produced during evaluation and measure the resulting ROC AUC. However, we found that this approach leads to misleading evaluation results in our case as it makes the assumption that the relative ordering between any pair of scores is equally important; this is not true for us since these scores are coming from a number of different customers, and we only care about the relative ordering of scores within a customer. That is, if a score given to a fraudster from customer A is less than the score given to a good user from customer B, this should not count against our system, as it does not say anything about the accuracy customers A or B will see.
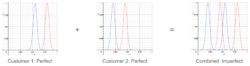
If all of our customers had identical operating parameters, integrations, and fraud problems, this would be less of an issue. Of course, this is not the case — our customers have a wide range of integrations unique to their vertical, use case, and other restrictions. For example, some of our customers are unable to integrate with our Javascript snippet, which generally results in a “dampening” effect on their score distribution — i.e., the separation between the positive and negative distributions is reduced due to a lack of high-precision signal. Combining score samples from such a customer with those from a customer that is integrated with our Javascript snippet can lead to our evaluation portraying a change that is positive for both individually as being negative in the aggregate. An extreme version of this case is outlined in these graphs:
Solution: focus on summary metrics from each customer
Ever since we had some experiments fall victim to this problem, we have been sure to partition score samples by customer prior to applying any binary classification metrics. This, of course, leads to many more summary metrics that need to be considered, which motivates our final lesson of the day…
Statistical tests help to surface the most important results of an experiment
Problem: there is no good way to collapse summary metrics across customers
Given a collection of ROC AUC metrics for all customers, we need some way of boiling them down to a small handful that could all reasonably be examined by the engineer running the experiment. A natural first attempt would be to take a (possibly weighted) average over these metrics. We tried this initially with both volume-weighted and unweighted averages. However, we quickly found that neither worked that well:
- Unweighted averages were too noisy, as we have many customers with just a handful of positive samples.
- Volume weighted averages tended to be dominated by the very largest customers, such as Airbnb, and would hide significant improvements for our medium-small customers.
Solution: use statistical tests to filter through results
The most helpful lesson we’ve learned when it comes to consolidating experiment results is to lean on statistical tests wherever possible. By aggressively applying tests to more granular metrics, we are able to ensure that only interesting comparisons are surfaced when evaluating an experiment.
We apply this lesson to the collection of per-customer ROC AUC metrics mentioned previously by producing confidence intervals around each metric using the following formula:
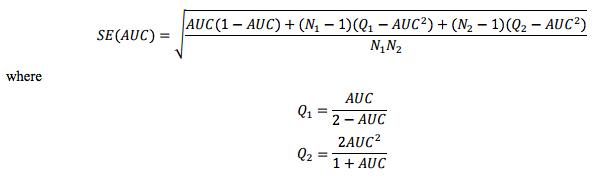
This formula is described in more detail here. Constructing confidence intervals in this manner allows us to quickly filter out all individual comparisons that are not significantly changed at the 95%, 90%, etc., confidence level. By incorporating these confidence intervals into our Experiment Evaluation page (to be described in the next post in this series), we are able to quickly find which (customer, abuse type, model) combinations are most significantly affected by an experiment. From there, we can then view individual ROC curves to get a more in-depth sense of the effect of an experiment.
Key takeaways
To summarize, effectively and efficiently comparing experiment results can be a non-trivial problem, but following these guidelines can help:
- Ensure summary metrics correctly represent the usage of your models.
- Only consider comparisons that represent the performance an end-customer sees.
- Statistical tests applied to accuracy metrics can reduce noise in experiment evaluation.
In the next and final post in this series we’ll discuss some of the tools we have built out that make it easy to run and analyze experiments correctly.
Can’t get enough machine learning? Come fight fraud with us!