Deep Learning for Fraud Detection
By Ralf Carvalho and Alex Paino
Introduction
Sift Science is an online trust platform that uses machine learning to prevent various forms of abuse on the internet, including payment fraud, fake content and account takeovers. Customers like Airbnb, Indeed, and Wayfair rely on us to keep fraud away from their services before it can increase chargeback rates, drive good users away, or require costly asset recovery for breached accounts.
A typical integration with Sift involves one or more of our four data ingestion APIs:
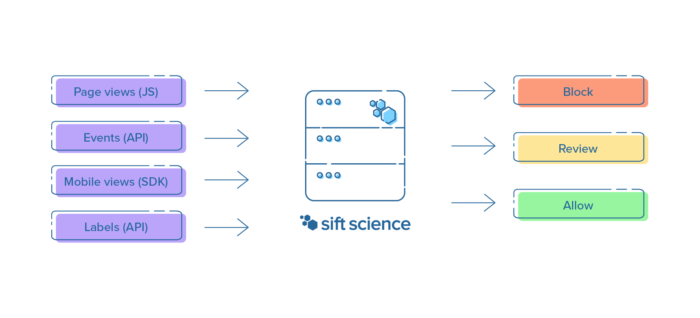
We use this data to train models that distinguish fraud from good user activity, using signals as varied as browser agents, transaction amounts, and mobile OS versions. These models produce scores that determine the likelihood of a given activity being fraudulent, such as a login attempt or a job posting. To train these models and evaluate our accuracy we use fraud analyst decisions and chargebacks as ground truth.
From this raw data we extract features that are good indicators of fraudulent behavior. This includes the distance between the billing and shipping addresses or whether some property of this user session has been linked to a fraudster elsewhere in our customer network. Typically we break this down into three categories:
- Identity features — who the user is: What is their email address? What about their device fingerprint?
- Behavioral features — how the user behaves: How many posts have they written in the last hour?
- Similarity features — how many users look like this user: How many accounts share this IP, billing address, etc.?
Modeling these signals is relatively straightforward, as is identifying suspicious values. For example, an account posting dozens of job ads within a few minutes is likely phishing job seekers info, while accounts sharing the same IP address with several others are more likely to all be from the same person. These features are fed into our modeling stack, which up until recently consisted of three different algorithms:
- Logistic Regression: simple yet powerful linear classifier.
- Decision Forest: flexible algorithm capable of modeling conditional distributions.
- Naive Bayes: model capable of learning new fraudulent behavior within a fraction of a second of it showing up anywhere in our network.
We’ve grown this toolkit of algorithms and carefully curated features since Sift’s inception in 2011. Over time, however, it became evident that relying exclusively on hand-engineered features like those above can leave gaps in modeling user behavior. This happens because they make it hard to model behavior over time in a general way, such as how a user navigates a customer’s website or mobile application. For example, a fraudster can be careful in setting up their email accounts, using different devices and IPs for each account, and still slip up by browsing in a very unusual way (e.g. with atypical timing between page views, as in a scripted attack). This led us to explore signals derived more directly from this sequence of interactions with our customers’ services.
Modeling user activity sequences
Many fraudulent activity sequence patterns are usually immediately obvious to a fraud analyst, but modeling them through hand-engineered features can quickly devolve into a wild-goose chase. Take credit card testing as an example. Fraudsters want to do as little work as possible to achieve their goal, so they may use the same account to quickly go through stacks of stolen credit cards in an easily recognizable pattern alternating between making transactions and adding new cards to the account. Another example of questionable behavior is when an attacker testing stolen credentials produces many suspicious logins and then posts an atypical quantity of content, or quickly navigates to value-extraction pages (to checkout, to transfer money to other users, etc). These patterns may be intuitive at a high level, but manually implementing a mechanism to detect them easily becomes impractical to do in a general fashion.
In the past, we explored n-gram models over user events (e.g. logins, transactions, changes in account info) with limited success. Clearly we needed something more powerful, something capable of automatically identifying patterns in user behavior that help discriminate bad actors from good users. Thanks to the time series of user activity that we build from customer data, we are able to use powerful sequence models to model user behavior at a higher level than before. We sketched out the following plan to do a first investigation of this idea:
- Choose a few customers to focus on to iterate more quickly on modeling performance.
- Massage our dataset into a format more appropriate for time series analysis.
- Train a sequence model on this new dataset.
- Evaluate the performance of a combination of this sequence model and our existing models.
This plan was first executed during one of our biannual week-long hackathons, where engineers of all levels (including interns!) get to explore something cool that does not need to be related to their current projects or team. Some of the products and technologies we use every day began as hackathon projects, including Account Takeover and Spark. The bigger effort to introduce deep learning to Sift was driven over a year ago by four engineers, including an intern who came back as a full-time engineer and brought this work from experiment to production as their first project.
During this hackathon we chose a few customers across various verticals that had large enough datasets to build rich models. Unlike our previous models, the sequence model works exclusively on a sequence of user events. As users interact with a customer’s service we receive a stream of timestamped events, which we use to identify suspicious usage patterns. An example of a benign event sequence (producing a low fraud score) might be:
- User creates an account
- Signs in a few seconds later
- Browses the website for a few minutes
- Logs out a few minutes later
- Signs in again 2 days later
- Searches for a given type of product
- Adds item to cart and checks out a few minutes later
while a fraudulent session (producing a high score) may look like
- User creates an account
- Signs in half a second later
- Goes straight to a product page
- Adds item to cart and checks out a second or so later.
- Updates their credit card on file a few minutes later.
- Orders another item with this credit card within another few seconds.
We combine the sequence model’s prediction with predictions from our other models to create the final fraud score. For example, in the first case our other fraud signals could still tip the scale towards a high score given enough evidence, which might indicate a manual fraudster rather than a scripted attack.
To capture the intuition above we encode each element of this sequence as a vector containing a mixture of numeric and categorical features. As an example of numeric features we can use the time interval between events, while for categorical features we may have a one-hot encoding of the event types.
As for the modeling algorithm itself, popular methods for sequence classification include Hidden Markov Models and Recurrent Neural Networks. In order to minimize manual tuning of hidden state spaces and manual input feature transformation we decided to go with the latter option, which can both automatically find a good feature embedding of the raw input sequence as well as capture its short and long-term dynamics.
In order to achieve quick prototyping in Python while keeping an easy path to production in our Java codebase, we implement this model using Keras and Tensorflow. The model itself is a Long Short-Term Memory (LSTM) network using a masking layer to handle variable-length sequences. The LSTM uses both regular and recurrent dropout and is optimized using RMSprop. We also performed a grid search over a few different hyperparameters (e.g. number of layers, layer dimensionality, dropout rate, etc.) to do basic architecture search, ending up with a relatively simple model. The entire model training pipeline, from preparing a dataset to training models and running validation experiments, is implemented using Airflow and PySpark. Check out our other blog post on Airflow to learn more!
Results
As discussed in a previous blog post, measuring model improvements at Sift is non-trivial due to several factors, including:
- The fact that our final fraud scores are computed by ensembling several models that are trained independently.
- The fact that we have thousands of different models among all our customers and need to efficiently decide which accuracy changes are actually significant and worth deploying.
- The constantly evolving variety of fraud patterns targeting each of our customers.
We now explain how these three points affect us and how we addressed them in the process of properly evaluating the sequence model.
Measuring accuracy with ensemble models
In order to make good use of the quantity and complexity of the data available to us, we serve customer scores using ensemble models made up of components that include any of the different algorithms described above as well as models tuned to the subsets of our data most relevant to a particular customer. Consequently, when measuring accuracy it is important that we compare these ensemble models rather than individual component models. The reason is twofold:
- A component model may be finely tuned to a particular subset of signals. For example, the sequence model does not see the hand-engineered features used to train other models, so directly comparing it with any of them would not be meaningful.
- An improvement in a given component model may already have been accounted for in another component. For example, manually adding feature interactions in Logistic Regression could increase the accuracy of that individual model, but not necessarily move the needle for an ensemble that already contains a non-linear model such as a Decision Forest.
Sifting through model changes using statistical tests
To address the second difficulty above we resort to statistical significance tests on the area under the receiver operating characteristic curve (AUC ROC), which is a threshold-invariant accuracy metric for soft classifiers. As an example, if we wanted to evaluate whether a new feature produces a meaningful improvement for a given customer, one might compare the AUC ROC of the model before and after adding that feature. However, due to the sampled nature of our dataset, an apparent change in AUC ROC is not necessarily statistically significant as it could be due to chance.
To be more certain that this difference is meaningful we instead look at confidence intervals around this AUC ROC. Intuitively speaking, we can be more certain that the difference between two experiments is statistically significant if these intervals do not overlap. Recently we have implemented a more rigorous version of this test (based on this paper) that relies on the additional property that we use the same test dataset for both experiments. In that case, the ROC curves are correlated and we can obtain a tighter confidence interval around the difference in AUCs.
Concretely, we need to check that the new ensemble models containing our sequence model prediction show a statistically significant improvement over the original ensembles. We can visualize this comparison like so:
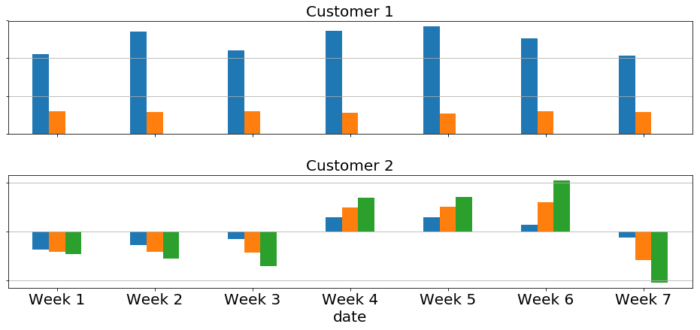
In the picture above we see the AUC profile over several different datasets for two customers. The blue bar indicates the AUC change of the enhanced ensemble containing the sequence model compared to the baseline (positive is good, negative is bad). The orange bar is the confidence interval of the baseline’s AUC (its sign follows that of the blue bar for easier comparison) — we want this to be much smaller than the blue bars for a stronger statistical test. Finally, the green bar is the amount of overlap between both experiments’ AUC confidence intervals — ideally this should be zero so that the experiments are meaningfully different. The best case scenario is that of the first customer — large blue bars with no green bars. The second customer does not have a consistent trend and shows significant confidence interval overlap throughout, suggesting that it does not benefit from this model.
Many of our customers are more like the first one above, indicating that the sequence model generally increases our ability to catch fraud in a statistically significant way. Specifically, we tend to see reductions in “error” (defined as 1 – AUC) of around 5-15% due to this model.
Fraud patterns change over time
Part of what makes this industry so interesting is that fraudsters are constantly changing their tactics in response to any improvements in fraud detection, making it a decidedly non-stationary machine learning problem. While one of the algorithms we use (Naive Bayes) can be easily updated online, it’s more challenging to do the same for our other more complicated models.
One way to address this is to constantly retrain our models on recent data. Since this is an expensive task, it’s worth investigating how often we need to do it. To estimate this we ran several experiments where we trained sequence models on increasingly older chunks of data and evaluated them against a fixed future validation set, following the user/time split described in this blog post. If the model is stable, i.e. if it does not significantly change over time, we expect our accuracy metrics to change very slowly or remain mostly the same.
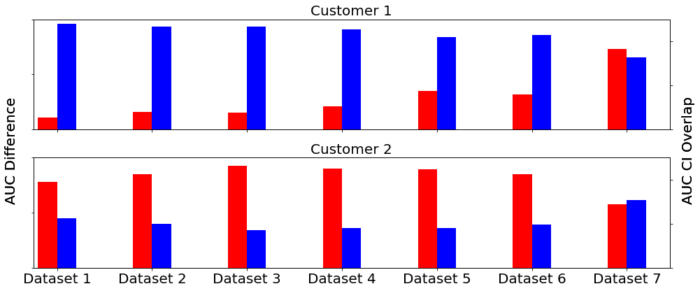
The plots above illustrate this experiment setup. The first two bars correspond to the model trained on an early dataset, whereas the last two bars are for a model trained on a dataset very close in time to the one used for testing. The red bar indicates the actual AUC difference between the enhanced ensemble model and the baseline model, while the blue bar measures the overlap fraction between the AUC confidence intervals of both models.
Intuitively we would expect what shows up in the first plot: earlier models have high overlap and low actual AUC difference (implying that the confidence intervals are almost identical), while newer models reverse this pattern (suggesting that the enhanced ensemble improves meaningfully over the baseline). However, as seen in the second plot, the model does not always evolve monotonically over time. This suggests that these particular fraud signals may be more fundamental and static, which may change in the future now that we are catching them.
Deploying neural networks to production
Now that we’ve determined these models can improve accuracy, we need to deploy them to production. One of the benefits of using Keras to prototype models is how easy it is to export them as tensorflow computational graphs. These can be served in production by a plethora of different tools, from low level libraries such as the Tensorflow Java API to specialized packages like Tensorflow Serving as well as hosted services like Google Cloud ML or Amazon SageMaker. These options vary a lot in terms of performance goals and how they fit within an existing production environment. Our final choice of technology had to satisfy these requirements:
- Low Latency and High Availability: We are on the critical path for most of our customers, from login forms to checkout pages, so we take latency and availability very seriously.
- Leverage existing infrastructure: We would like to avoid increasing operational complexity by reusing our existing serving infrastructure as much as possible rather than adding new services, which also lets us reuse internal tooling for, e.g., versioning models or testing multiple models with live traffic.
And thus we chose the Tensorflow Java API, which
- Offers great latency characteristics.
- Provides an easy way of loading a model from an exported computational graph and performing inference on it.
- Can be easily versioned, deployed and instrumented in the same way as our other in-house Java-based classifiers.
To validate the performance requirements we ran experiments in a separate environment with artificial traffic at much higher rates than production, checking that our median, 99p and 99.9p scoring latencies remained within our existing SLAs and that our memory consumption did not increase significantly. This is especially important for a JNI-based library like Tensorflow, whose consumption of non-heap memory in the JVM has to be carefully managed. Indeed these metrics are comfortably lower than for existing models so we can easily experiment with more complicated neural network architectures in the future.
These experiments are only the first step in our deployment plan for new models and services. Once we have validated that the code is robust under exceptionally high traffic, we deploy it in test mode using a mirrored fraction of live traffic to surface any corner cases caused by real data. This deployed model does not serve scores to customers; rather, we record these scores internally and analyze their distribution to look for any anomalous patterns or see if they break any assumptions made by any customer’s automated systems that depend on the pre-existing score distribution, which we address in another blog post. We also use this opportunity to help ensure that deploying Tensorflow models works as expected. The sequence model was left in this mode for several months. Once we confirmed that it was safe to release we launched it to an initial list of customers in January.
Lessons learned
One of the main learnings from this project is the importance of flexible experimentation tooling to help iterate and validate ideas more quickly. At the beginning of this work we had a general experimentation mechanism as part of our model training pipeline which was a bit too general and more expensive than necessary. In order to optimize the model architecture or explore other input representations we implemented a more specialized pipeline that only produced the data necessary for evaluating the sequence model. This made the development cycle significantly more productive. The success obtained here helped motivate the development of better internal tools to evaluate individual models more efficiently.
We also learned that trying experimental or unconventional tech can pay off beautifully when it enables us to iterate more quickly. The Tensorflow Java API was (and still is) an experimental part of that project, and yet it was very easy to integrate and has worked perfectly well since we first integrated it. This let us reap the full benefits of the Tensorflow platform, including Tensorboard, easy-to-use frameworks like Keras and new features that we are experimenting with internally (such as Edward, a probabilistic programming library). Additionally, we were able to train most of our models using simple CPU-based EC2 instances, which helped keep our model training fleet mostly unchanged.
Another surprising fact was how stable this sequence model is. We usually see improvements over time for our other models thanks in part to the batches of fresh data received between model releases. It is very likely that the next big leaps in model performance will come from increasing the richness of the data that this model sees (i.e. adding numeric and categorical features as described above), which is very exciting for model developers and data scientists like us.
Next steps
There are several interesting directions in which to take this work, such as:
- Exposing it to additional fields from events, such as transaction amounts, that could help it capture even more subtle fraud patterns without too much manual work thanks to the flexibility shown by neural networks of automatically learning useful features.
- Identifying user idiosyncrasies to help combat account takeover.
- Investigating opportunities for transfer learning between our abuse products.
- Exploring ways to interpret model predictions and offer a similar level of model explainability as we do for our other models.
- Expanding the list of customers that benefit from this work.
Key takeaways
- We have successfully leveraged recurrent neural networks to keep fraudsters at bay and reduce friction for good users by modeling how users navigate a customer’s website or mobile app.
- This sequence model was trained using Keras and deployed using the Tensorflow Java API.
- We put this model through several performance and accuracy tests and noticed it doesn’t have to be retrained very frequently to keep up with fraud patterns.
- This new approach of modeling user behavior offers great promise in capturing more complicated kinds of fraud without incurring the substantial manual work entailed in defining explicit features like “number of login attempts in the past hour”.
Can’t get enough machine learning? Come fight fraud with us!